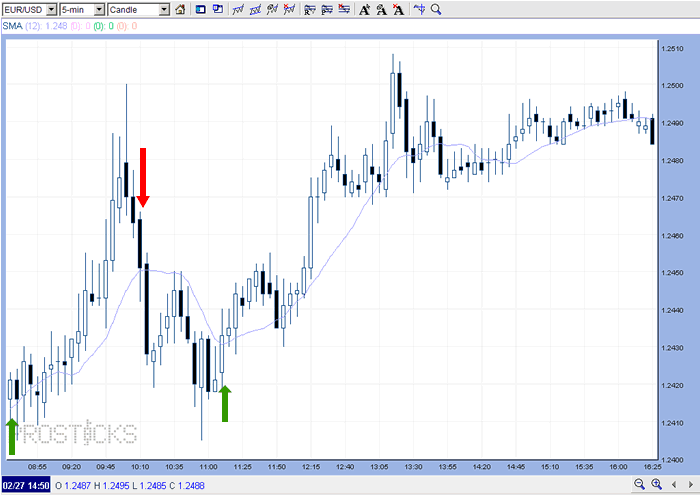
In the strategy section, I discussed the importance of using a well-defined trading methodology. The basic moving average crossover strategy provided in this section is an example of how a specific trading strategy can be created and applied.

Crossover strategies are used by many stock, currency and futures traders because of their simplicity. It will also suffice to clearly illustrate the point that I have made before: in trading we need specifics, not generalities.
The chart above shows a 5-minute candlestick chart (open, high, low, close) of the Euro – Dollar currency pair (go the the currency trading section to learn more about how to trade them).
White candles indicate that the closing price, during the corresponding 5-minute period, was higher than the opening price. Black candles indicate the opposite. Superimposed on the chart is a 12-period Simple Moving Average (SMA). Since each period (candle) represents 5 minutes of price action, the 12-period SMA gives a running arithmetic average of the closing prices of the last 12 five-minute periods. With me so far?
All moving average crossover strategies have certain similarities. When either the price or the shorter-term moving average crosses over the longer-term moving average, it considered a buy signal. When the price or the shorter-term moving average crosses under the longer-term moving average, it is considered a signal to sell.
Since in the graph above we only have one moving average, the trading signals are generated when the price crosses over or under the SMA. Notice that even though there are many other parts of the strategy that are not defined, so far the entry signals are QUANTITATIVE and specific. This is very important regardless of the trading strategy we are using.
In the figure above, three points are indicated on the chart where the initial move above (green arrow) or below (red arrow) the moving average produced a continuation in that direction. To get an idea of the size of the movements, notice that the vertical scale (right hand side of the chart) is divided in 0.0010 subdivisions. This is the equivalent of 10 pips or $100 per contract traded (1 pip is equal to $10 for the EURUSD pair). Let’s take, for example, the first green arrow at the extreme left of the chart. After the price crossed over the moving average line (close to 1.2420), it continued to rise until reaching a high of 1.2500 (an increase of 80 pips or $800 per standard contract). In the example of the red arrow, when the price crossed under the moving average (close to 1.2450), the sell signal was generated. The price continued to drop another 45 pips after that, until a low of approximately 1.2405 was reached.
Notice that there are many things that still have to be defined for the crossover trading strategy to be complete. Let’s take the entry signal for example. Notice that even when the price crosses over or under the moving average, it still bounces or oscillates back and forth over the moving average line for a while.
If we simply bought the second the price went over or sold the instant the price went under the moving average line, we would have had a problem. Why? Because we would have been constantly whipsawed (or forced to enter and exit repetitively) in and out of trades. The severity of this problem could have been greatly reduced by requiring that the price go over or under the SMA by a given number of pips before entering a trade, that a stop loss unrelated to the crossing of the price and the SMA be used, that another indicator or signal be used as a double confirmation for entry, or by using a combination of these things. Regardless of what conditions are used, they have to be defined.
Another issue that arises with a simple moving average crossover strategy is that it works great in trending markets (markets that tend to continue rising or falling), but horribly in trading or consolidating markets (markets that trade back and forth in a narrower than normal range). This becomes obvious by looking at any section on the chart where the price bounces back and forth over and under the SMA in a narrow price range.
Before the crossover strategy can be complete, we will also need to define how we will manage winning trades. So you see, even for a basic strategy like a moving average crossover system, there are many things that have to be specified before the strategy is complete and ready to be traded. I think that using the strategy in a general way will eventually lead to unnecessary losses.
Click here to read more about the importance of using a well-defined strategy to day trade.

